- MVP -
UX Research - Current Process
Preliminary research was conducted with WOTC clients and their account managers to understand their current WOTC workflow within SCP and what forecasting they engage in, if any.
When asked about the current experience, the following pain points were frequently brought up by clients and associates:
- Many users aren't interacting with available analytics because they are "static" and "boring"
- Larger clients are relying on custom WOTC ad-hoc forecasting reports provided by ADP's CSM team
- A client looking to forecast their tax credit value would need to: obtain their ADP Credit Report, obtain their ADP 75 Hour Report, gather expected hiring data from their human resources team, and gather historical data to create their own forecast
- Most clients want to know what is urgent/"To Do" list, but this information is not surfaced for them
- Highly-used items, like reports and certain utilities, are not necessarily the most relevant to our target users, they're just the easiest to find
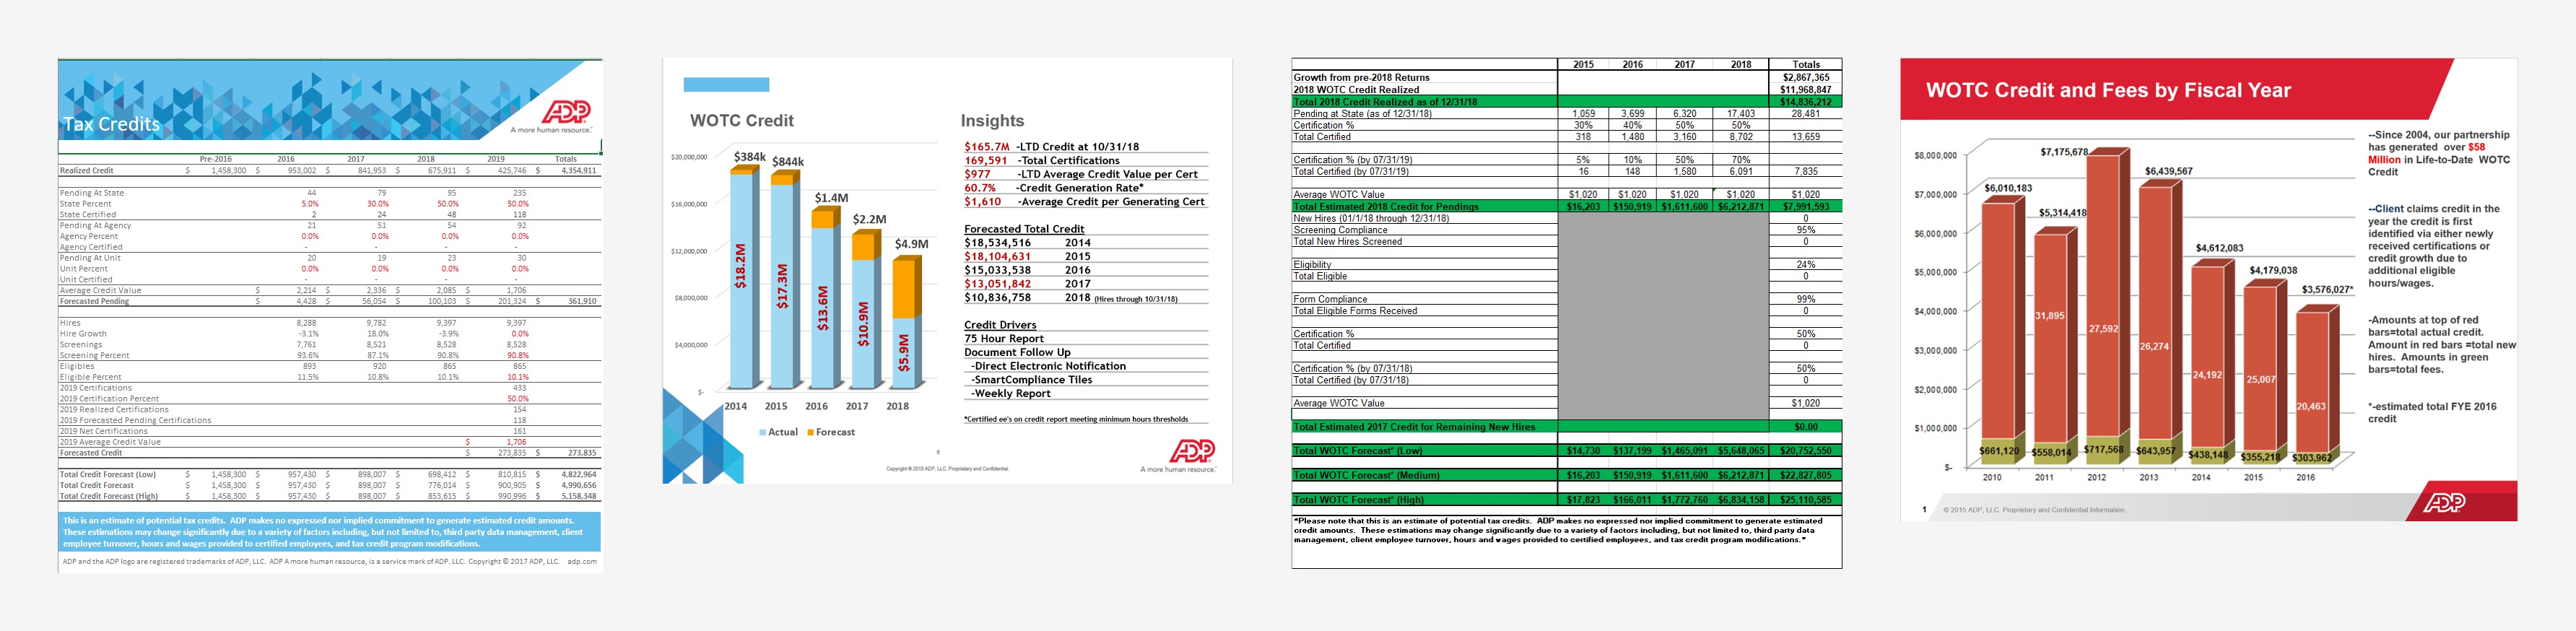
- Examples of WOTC forecasting reports prepared by ADP associates -
From the interviews, I was also able to identify two different methods clients use for WOTC forecasting.
Annual Filer
An annual filer client only cares about the credit that is earned on eligible wages paid in the fiscal year. Generally amends multiple prior returns to take advantage of credit earned on recent certifications issues for hires from prior years.
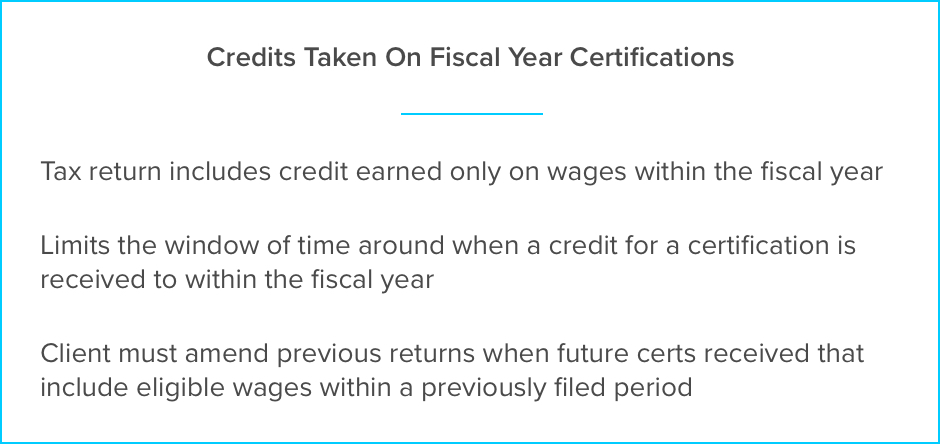
Result: Total estimated by fiscal year is expected to match what a client files on a current or amended fiscal year return
Growth filer
A growth filer client is one that claims the credit in the year certified and not in the year wages are earned, therefore they do not amend their tax returns.
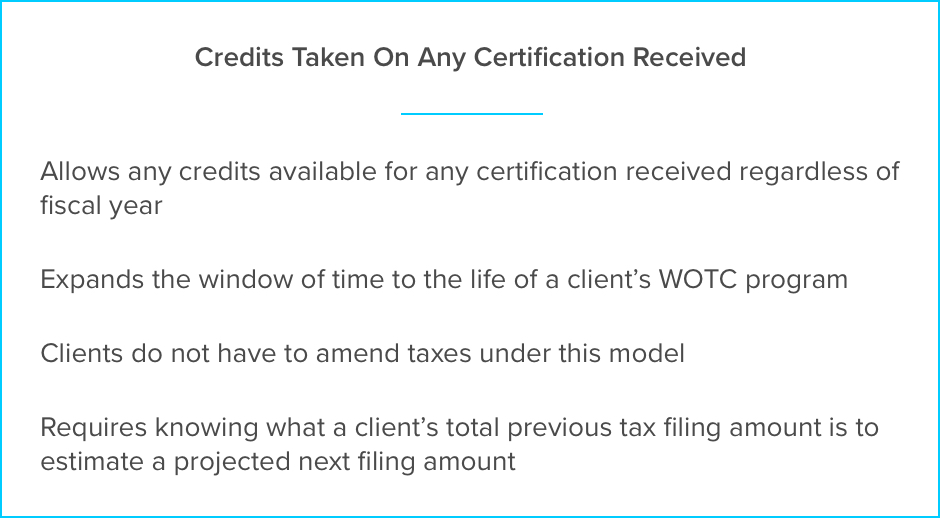
Result: Next Filing is the result of Total Estimated Credit for All Time – Total Previous Tax Filing Amount
After I completed my interviews with our clients and ADP associates, I went over all the data collected and compiled the following use cases for the WOTC Forecast dashboard.
[PRIMARY] Tax Credit Estimate/Next Filing Amount for the Current Fiscal Year for Wages Earned (Fiscal Year Open)
As a tax professional wishing to forecast my expected total credits for within a fiscal year for wages earned, I want to be able to forecast for the Current Fiscal Year to understand what I may be likely to claim on my next tax return.
Needs: Fiscal Year; Certifications Received by Date
- Tax Professional logs into SCP to execute a forecast for FYE January 31, 2020. Today’s Date is April 30, 2019, and their company filing date is September 1, 2020
- They select Filing for: FY 2019
- They enter Credits Received by Date: July 31, 2020
- ADP’s forecast should display: Next Filing (this number should match the Total Estimated Credit Value), Credits Realized, Potential Growth, Pending Certifications, Projected Hiring, and the Total Estimated Credit value for all certifications received by July 31, 2020 where there were wages earned between February 1, 2019 (FYS) and January 31, 2020 (FYE). These values will not include certifications received for prior fiscal years
[PRIMARY] Tax Credit Estimate/Next Filing Amount for Any Certification Received (Fiscal Year Open)
As a tax professional wishing to forecast my expected total credits for all certifications received, I want to be able to forecast for the Current Fiscal Year to understand what I may be likely to claim on my next tax return.
Needs: Fiscal Year; Certifications Received by Date; Total Previous Tax Filing Amount
- Tax Professional logs into SCP to execute a forecast for FYE January 31, 2020. Today’s Date is April 30, 2019, and their company filing date is September 1, 2020
- Tax Professional will need to provide the total previous tax credit filing value to date that they provided to the IRS
- They select Filing for: FY 2019
- They enter Credits Received by Date: July 31, 2020
- ADP’s forecast should display: Next Filing (Total Estimated Tax Credit – Total Previous Tax Credit Filing amount), Credits Realized, Potential Growth, Pending Certifications, Projected Hiring, and the Total Estimated Credit value for all certifications received by July 31, 2020. These values will include all certifications received to date. The values displayed are forecasted Life of Program numbers
Tax Credit Estimate/Next Filing Amount for the One Future Fiscal Year for Wages Earned (Fiscal Year Future)
As a tax professional wishing to forecast my expected total credits for within a fiscal year for wages earned, I want to be able to forecast for the Future Fiscal Year to understand what I may be likely to claim on my future tax return.
Needs: Fiscal Year; Certifications Received by Date
- Tax Professional logs into SCP to execute a forecast for FYE December 31, 2021. Today’s Date is April 30, 2019, and their company filing date will be September 1, 2022
- They select Filing for: FY 2021
- They enter Credits Received by Date: July 31, 2022
- ADP’s forecast should display: Next Filing (this number should match the Total Estimated Credit Value), Credits Realized, Potential Growth, Pending Certifications, Projected Hiring, and the Total Estimated Credit value for all certifications received by July 31, 2022 where there were wages earned between January 1, 2021 (FYS) and December 31, 2021 (FYE). These values will not include certifications received for prior fiscal years. Numbers contained in this forecast will be all forecasted/estimated data; no realized credit value
Tax Credit Estimate/Next Filing Amount for the One Future Fiscal Year for any Certification Received (Fiscal Year Future)
As a tax professional wishing to forecast my expected total credits for any certification received, I want to be able to forecast for the Future Fiscal Year to understand what I may be likely to claim on my future tax return.
Needs: Fiscal Year; Certifications Received by Date; Total Previous Tax Filing Amount
- Tax Professional logs into SCP to execute a forecast for FYE December 31, 2021. Today’s Date is April 30, 2019, and their company filing date will be September 1, 2022
- Tax Professional will need to provide the total previous tax credit filing value to date that they provided to the IRS. This value will need to include an estimated value for years not filed
- They select Filing for: FY 2021
- They enter Credits Received by Date: July 31, 2022
- ADP’s forecast should display: Next Filing (Total Estimated Tax Credit – Total Previous Tax Credit Filing amount), Credits Realized, Potential Growth, Pending Certifications, Projected Hiring, and the Total Estimated Credit value for all certifications received by July 31, 2022. These values will include all certifications received to date. The values displayed are forecasted Life of Program numbers
Filing for the Previous Fiscal Year for Wages Earned (Fiscal Year Closed; Certifications Still Being Received)
As a tax professional, I want to be able to forecast for the Previous Fiscal Year for certifications being received for the previous Fiscal Year for wages earned so that I have the most accurate estimated credit value claimed on my tax return.
Needs: Fiscal Year; Certifications Received by Date
- Tax Professional logs into SCP to execute a forecast for fiscal year end (FYE) December 31, 2018. Today’s Date is April 30, 2019, and their company filing date is May 30, 2019
- They select Filing for: FY 2018
- They enter Credits Received by Date: April 30, 2019
- ADP’s forecast should display: Next Filing (this number should match the Total Estimated Credit Value), Credits Realized, Potential Growth, Pending Certifications, Projected Hiring, and the Total Estimated Credit value for all certifications received by April 30, 2019 where there were wages earned between January 1, 2018 (FYS) and December 31, 2018 (FYE). These values will not include certifications received for prior fiscal years
Filing for the Previous Fiscal Year for Any Certification Received (Fiscal Year Closed; Certifications Still Being Received)
As a tax professional, I want to be able to forecast for the Previous Fiscal Year for all certifications received for the previous Fiscal Year regardless of wages earned so that I have the most accurate estimated credit value claimed on my tax return.
Needs: Fiscal Year; Certifications Received by Date; Total Previous Tax Filing Amount
- Tax Professional logs into SCP to execute a forecast for FYE December 31, 2018. Today’s Date is April 30, 2019, and their company filing date is May 30, 2019
- Tax Professional will need to provide the total previous tax credit filing value to date that they provided to the IRS
- They select Filing for: FY 2018
- They enter Credits Received by Date: April 30, 2019
- ADP’s forecast should display: Next Filing (Total Estimated Tax Credit – Total Previous Tax Credit Filing amount), Credits Realized, Potential Growth, Pending Certifications, Projected Hiring, and the Total Estimated Credit value for all certifications received by April 30, 2019. These values will include all certifications received to date. The values displayed are forecasted Life of Program numbers
Fiscal Year Dates Change
As a tax professional, I need to be able to update my Fiscal Year Start and End dates so that my forecast reflects the correct filing year.
Needs: Editable Fiscal Year field
- Company merges with another company; filing date changes
- ADP does not have new filing information yet
- Tax professional wishes to run a more accurate forecast, but the dates do not match
- ADP Forecast dropdown should have a change fiscal dates option
Wireframes
The following MVP requirements were finalized with the PO:
Users will be able to:
- Choose the WOTC filing method they use, which will update the inputs and calculated values shown on the dashboard
- Edit certain fields to help them obtain the most accurate forecast for their estimated credit value
- Have a complete comprehensive view of everyone they hired - visibility on how many they hired and provide insights into why their compliance & credits are up/down
- Toggle between the previous fiscal year, current fiscal year, and one future fiscal year to do comparisons
- Access a details view that shows a breakdown of the client's history of tax credit filings
With this information in hand, I began wireframing the WOTC Forecast dashboard and created multiple explorations:
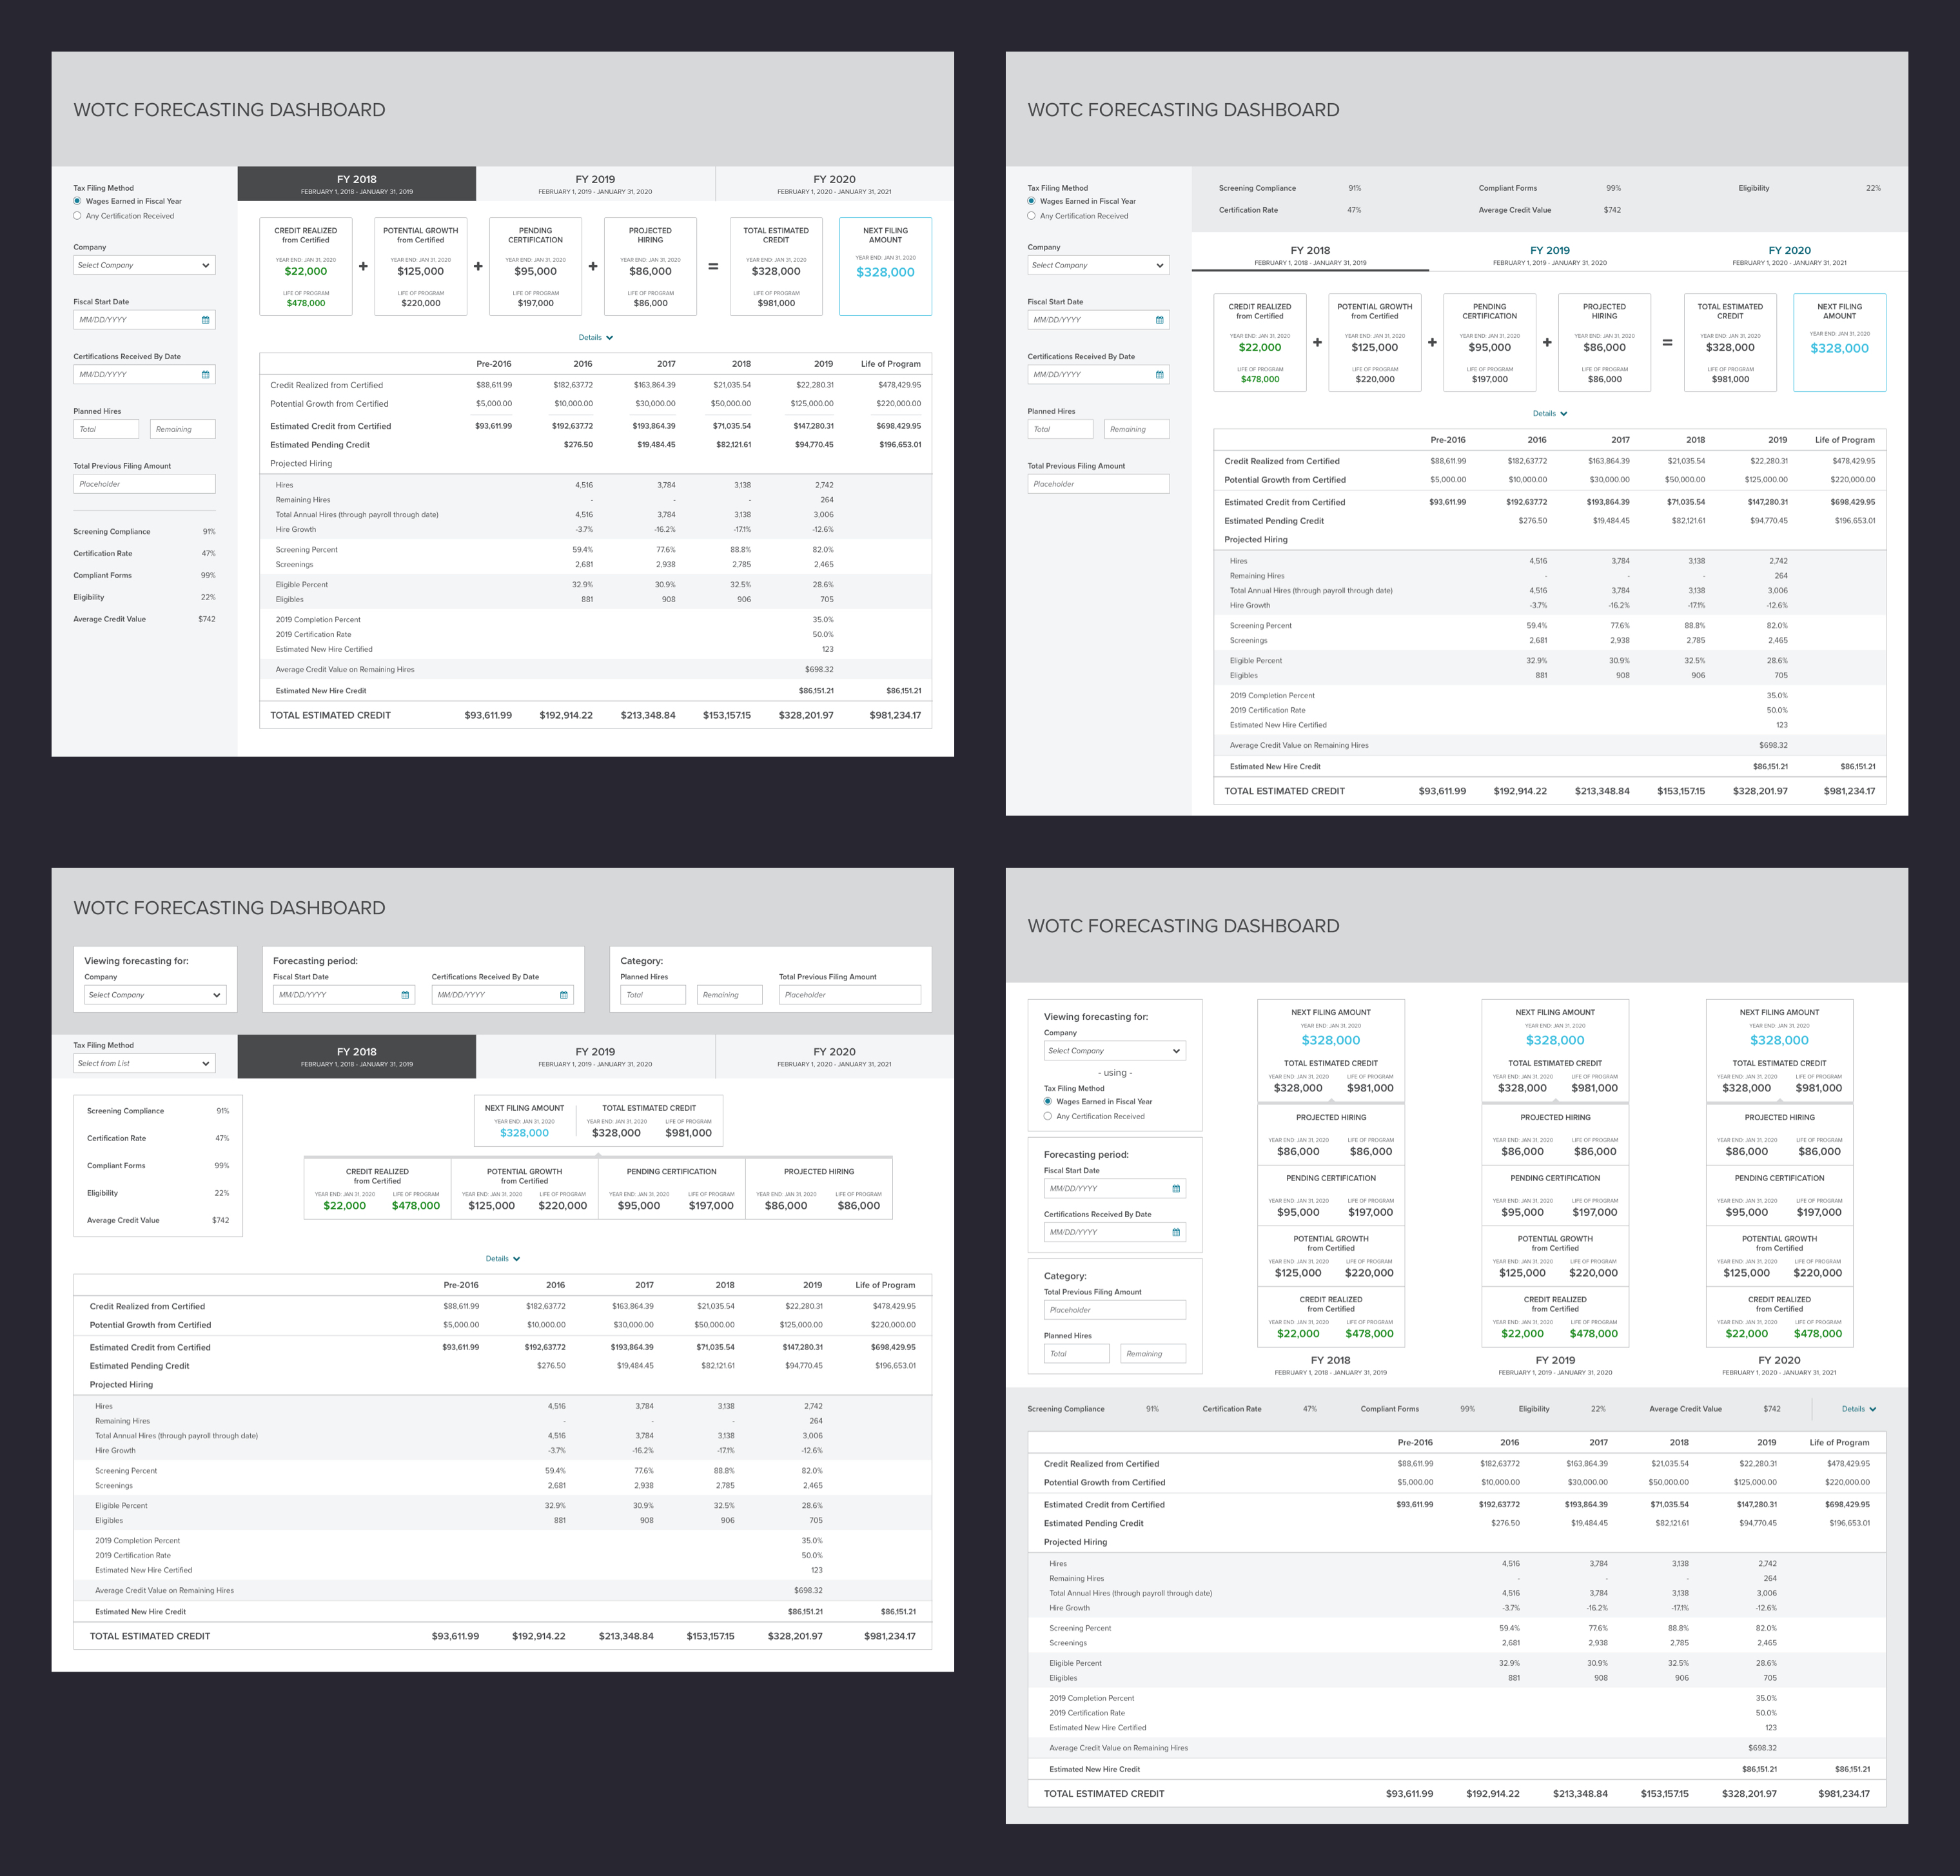
- WOTC Forecast Dashboard MVP Explorations -
What's Behind the Numbers:
Fiscal Forecast & Growth Forecast each have 5 parts:
CREDIT REALIZED from Certified + POTENTIAL GROWTH from Certified + PENDING CERTIFICATION + PROJECTED HIRING = TOTAL ESTIMATED CREDIT
Only Growth Forecast has:
NEXT FILING AMOUNT = Total Estimated Credit - Total Previous Filing Amount
- Credit Realized - Credit calculated on all certified individual payroll received
- Potential Growth - Credit that has not been fully recognized for a certified individual that has been hired, but has not realized full receipt of payroll. A client may have already received partial credit for this hire; any credit received is NOT reflected in this number, but is a part of “Credit Realized”
- Pending Certification - Credit that has not been recognized in any part. Individuals have been hired, potentially meet credit requirement(s), but certification has not been issued by a federal or state agency
- Projected Hiring - Credits that could be earned based on YoY (year-over-year) data. Takes into account previous hires, previous eligibility rate, previous certification rates, and the client’s average certification value
Mockups
As I worked towards refining my wireframes, I held a series of design reviews with my team members and the PO. I also presented my explorations to a couple of ADP associates to ensure the information shown was in line with the reports they were currently creating for clients. Utilizing all the feedback I obtained from the reviews, the following screens were finalized:

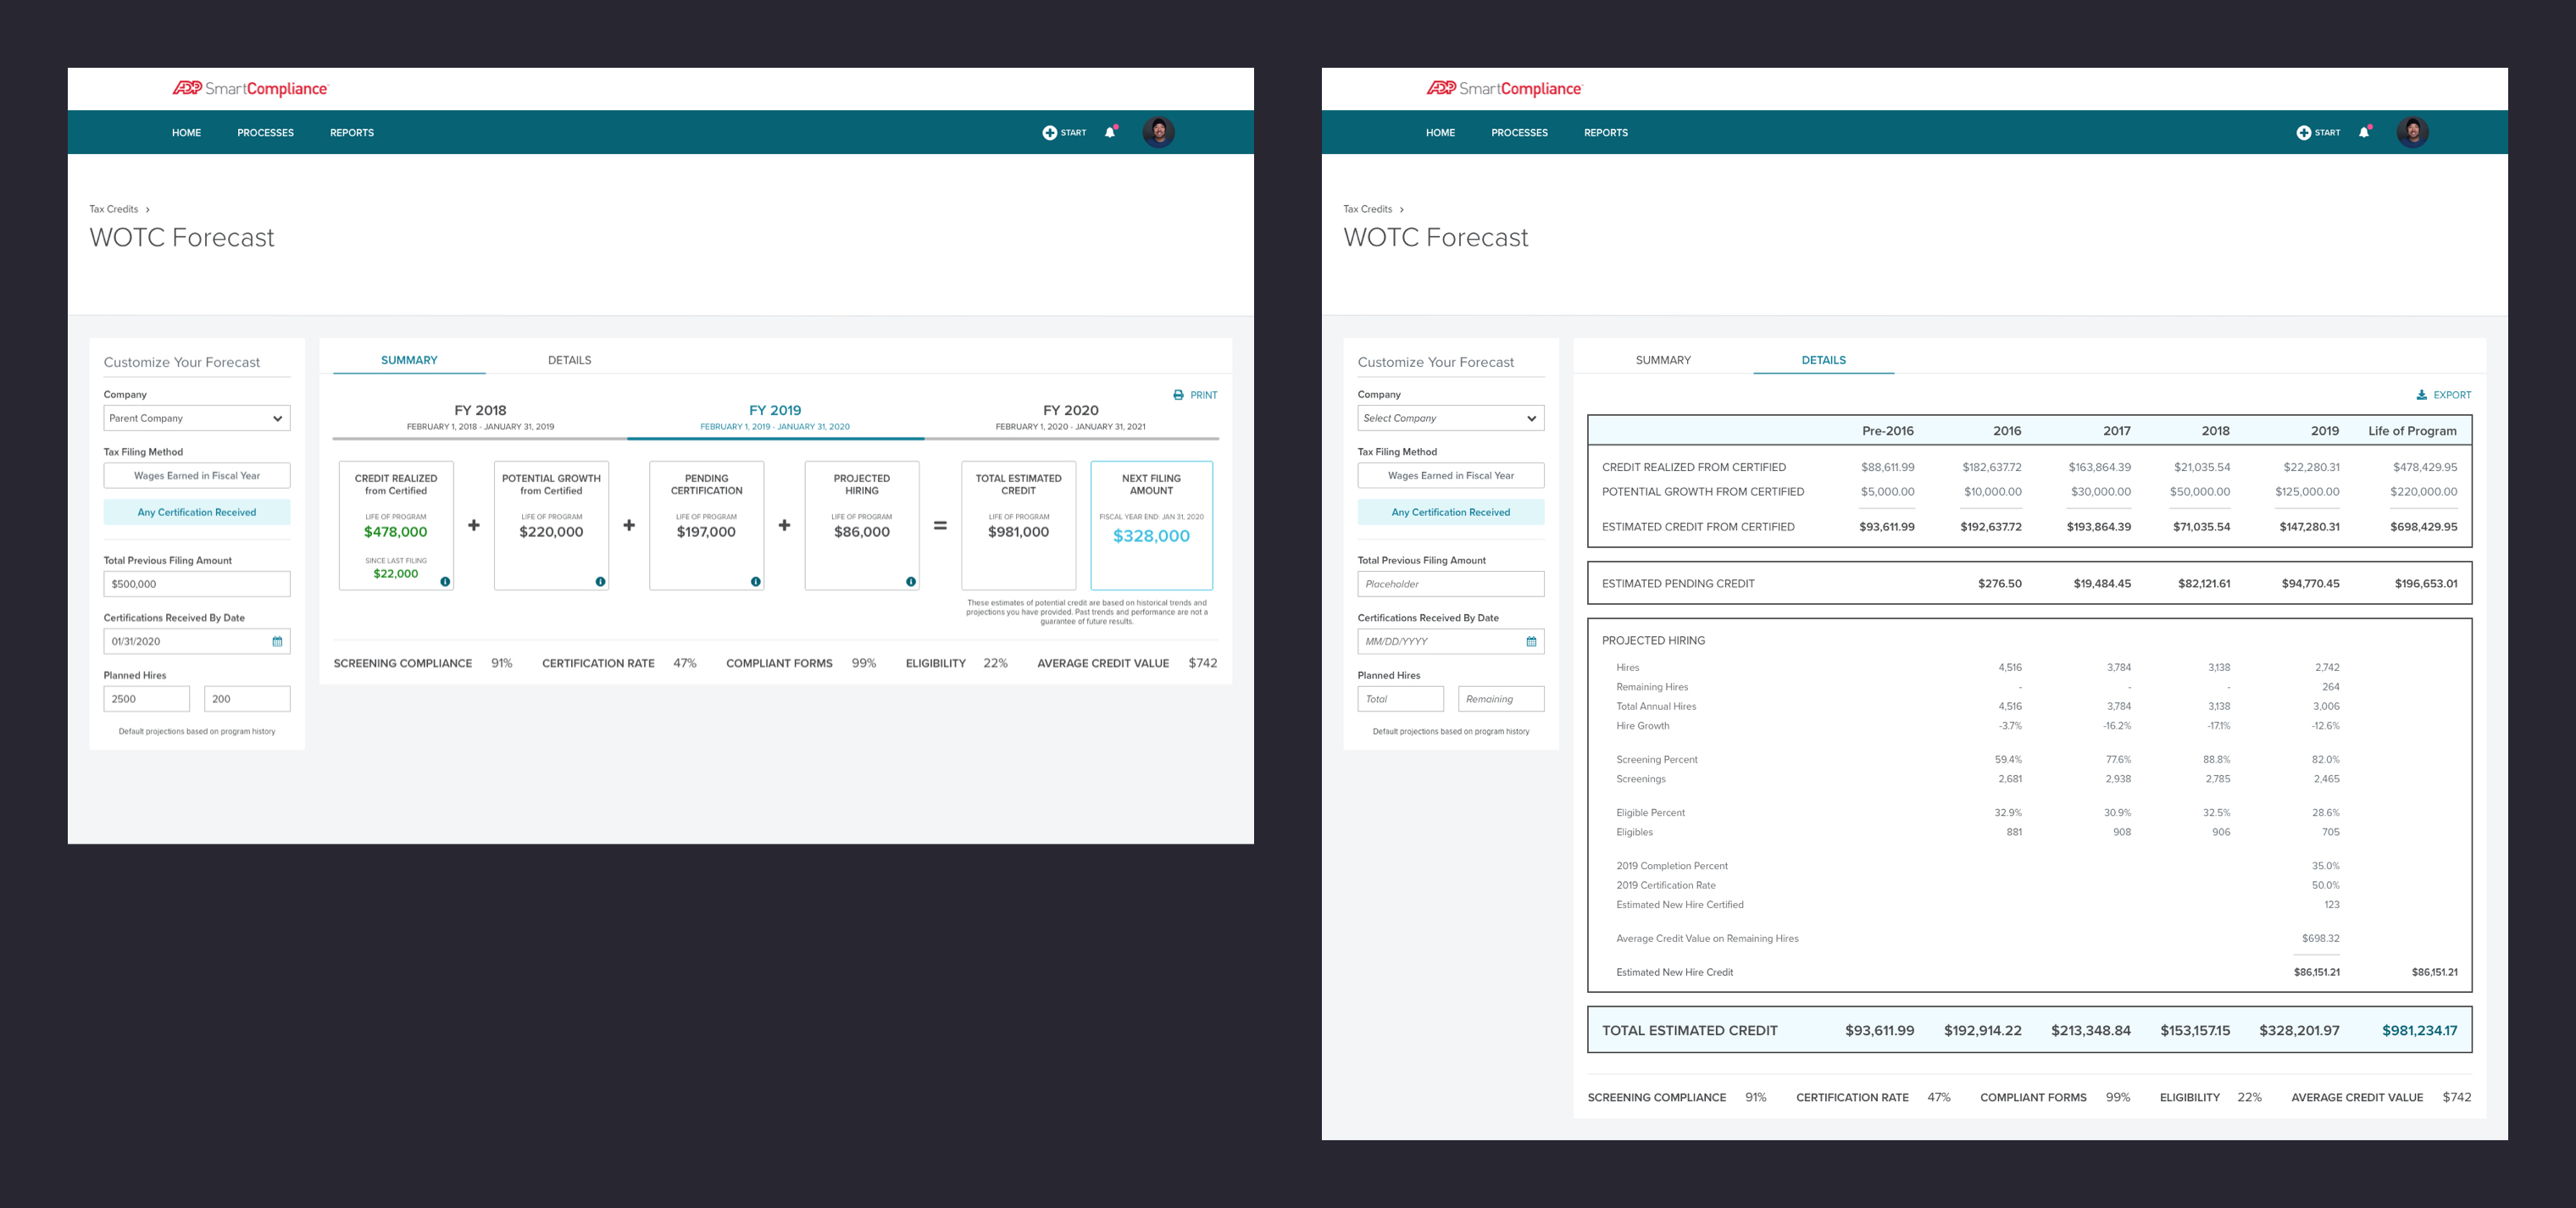
- Fiscal Forecast Mockups -
- Growth Forecast Mockups -
The dashboard will have two views users can toggle between since the functionality for Summary view is a lot different from the Details view
Summary View
- Credit components are shown that will change based on input from editable fields on the left side of the page
- Fiscal Forecast will show FYE and Life of Program values
- Growth Forecast will only show Life of Program values
- Next Filing Amount value is shown to help growth forecast users determine how much they can file for tax credits for the current and next fiscal year
- User will only be able to see values for previous fiscal year, current fiscal year, and next fiscal year
- Print functionality will be present since the summary is mostly used to show the executive team where the company is currently at and what goals have been set for the next year
Details View
- Table shows a breakdown of a client's history of tax credit filings and a detailed drilldown of how the Project Hiring value was calculated (for applicable columns). Let's the user see what trends have occurred
- Projected Hiring:
- Show historical head count
- Actual hire numbers
- Adjust projected hiring number
- Certain cell values in current fiscal year column and Life of Program column will change based on input from editable fields
- Export functionality will be present for users to be able to download and edit this data in Excel. Possible inclusion of option for exported file to contain more granular data if user needs it
"Customize Your Forecast" section for editable fields and non-editable information will be on the left side of the dashboard:
Editable Fields
- Company - default company is set to parent company, user can choose to view a child company
- Planned Hires
- Total Previous Filing Amount (Growth Forecast only) - needed for this tax filing method due to companies filing quarterly/provisionally, therefore ADP will not have clients' most recent filing amount. Dashboard can recommend amount based on last credit report initially, but user should be changing this field to obtain more accurate values
Non-editable Fields
- Remaining Hires
- Certifications Received By Date
"Behind the Scenes" percentages are included at the bottom of each view: these percentages are based off of historical data and helps users see where the forecast predictions values come from.
UX Research - MVP
As I finished working on the MVP mockups, I collaborated with one of our UX researchers to schedule some usability sessions with WOTC clients to validate my designs. This included creating a moderator guide, reaching out to ADP associates for their client lists, scheduling clients, and moderating the sessions. Each testing session was 60 minutes and consisted of one-on-one interviews followed by a usability test using an Invision prototype.
The primary objectives of the research were:
- Identify whether the new dashboard easily allows clients to predict their expected tax credit value without having to manually manipulate reports
- Unearth the greatest successes and challenges that occur while participants interact with the new design
- Understand participant tax processes while surfacing their most urgent “To Do” items
- Investigate the most relevant analytics needed for successful forecasting
The 4 participants consisted of:
- 1 Tax Department Practitioner with standard reporting - Growth filer with fiscal flair
- 1 Vice President of Tax with standard reporting - Fiscal filer
- 1 Tax Director with custom reporting - Growth filer
- 1 Tax Manager with custom reporting - Fiscal filer
Summary of findings:
- All participants mentioned that the new WOTC Forecast dashboard was “easy on the eyes” due to a “neater” presentation of information
- We observed “learnability” and “recall” in each session, two key factors in successful user interactions. Each participant illustrated understanding of the prototype as they spent more time with it (learnability). For example:
- One participant found the Total Estimated Credit on the Summary view, a total of $249,616. She then went to the Details view looking for that same sum. At first, she did not find the number on the Details view. She went back to the Summary view, found her number again, then went back to the Details view and found the Total Estimated Credit
- Learnability was reinforced by recall. The above participant’s ability to remember that the Total Estimated Credit was what she really wanted and was first discovered on the Summary view, which helped her find it on the Details view
- Most wanted the ability to view the Summary and Details sections on the dashboard while still having access to the Excel reports that they get today. The assumption was Excel spreadsheets provide further detail (i.e: employee-level detail/EIN information) and the ability to manipulate data while testing different scenarios. Also, some participants have devised “subtraction” shortcuts to manipulate Excel reports to get the exact information they need
- All participants expressed the desire to know where the numbers “come from”. This hunger for source data stemmed from more than a lack of label clarity. Participants wanted the “details behind the details” to instill trust and to support an IRS audit trail. They wanted to know:
- Are these numbers coming from ADP or are they self-reported from the companies themselves? Two participants expressed that the data would feel more “accurate” if it came from ADP, but then they all wanted the ability to manipulate the data as well
- Are these numbers actuals (historical figures from last year’s data)? Or are they projections?
- Will we still have an audit trail to provide the IRS when they perform yearly audits?
- All participants exhibited a clear desire to edit data so they could create various financial scenarios
- Some participants were confused about the purpose of the dashboard due to what seemed to them a combination of interspersed forecasting and “actual” information
- Life of the Program information did not resonate with participants as well as past year, current year, and next year information. We observed most participants seeking information within a given year. Only one of the four participants expressed that “Life of the Program” information was important
- All participants found the “footer percentages” helpful. “Screening Compliance” and “Eligibility” especially resonated. But all participants wanted clarification of what these labels meant. They imagined an interactive rollover, or some similar tool tip-like interaction to explain further
- Participant #4 could see this prototype replacing her ADP associate if the prototype clearly delineated the “actuals” vs. “forecasting” pathways to information
After each session, I debriefed with a couple of team members who were helping out by taking notes to discuss any interesting takeaways and affinity map their notes. Once I was done moderating all of the sessions, I reviewed the affinity maps and documented all findings within an express research summary. I presented the report to the PO and outlined the following recommendations:
- Reconsider visual treatment of tabs. Many participants did not interact with them. Some did not know they were clickable tabs. Part of this confusion may have been due to the fact that some tabs were disabled during some sessions, but even when fully actionable, one participant did not realize tabs were navigation elements
- Reconsider year tab labels. The date ranges, especially, do not seem to support task completion. Instead the date ranges confuse. Including the “FY” label next to the year confused most participants since not all participants filed by fiscal year; therefore using only the year as the main tab label or using more generic labels such as “Previous”, “Current”, and “Future” with the date ranges would cause less confusion. Another consideration is only allowing users to view data for “Current” and “Future” years, with a link to their credit report for the previous year
- “Life of the Program” data did not resonate as much with participants as data pertaining to a specific year. Because of this, consider highlighting Total Estimated Credit by year as much as possible, especially on the Details view. Currently Life of the Program is prominent due to teal font, and that is where many participants initially focused
- Participants found “Planned Hires” input label confusing. Changing this label to “Hires Year-to-Date” might provide clarity on what value users should input. Also, including the “Total Annual Hires” value along with “Remaining Hires” value may help provide clarity as well
- None of the participants seemed to notice the “Default projections based on program history” note at the bottom of the “Customize Your Forecast” section. Enlarging the font as well as providing more information on how these defaults were calculated would assure users that the data shown is accurate.
- Currently, the info icons within the individual credit value tiles are not very noticeable and there is disconnect between what the info icons are for with the tile headers. Moving the icons closer to the headers would help users understand that the tooltips provide an explanation of what each tile represents. Another possible solution is to have the respective tooltip appear whenever a user hovers over a tile with an option to toggle the visibility of the tooltips
- It has also been observed that most participants went straight to the Details view and since the info icons were not present next to the headers within this view, participants had difficulty understanding what those headers meant. Adding info icons to the headers in the Details view would help alleviate this issue
- The percentage headers at the bottom of the forecast were unclear to all participants. Providing explanations of what those percentages mean and where these values came from via tooltips (or other means) would aid users
- Tax Filing Method button labels need to be revisited, as none of the participants really understood what they meant. Including a tooltip explaining the labels could help users choose which tax filing method they utilize
- “Since Last Filing” label was confusing to participants as they were not sure if the value included all previous filings or just the most recent one. This value may make more sense to users if their actual data was used. However, to ensure clarity, the tooltip for the tile containing the “Since Last Filing” value should include an explanation of what that label entails
After a series of discussions, the PO and I agreed upon what next steps should be taken for the WOTC Forecast dashboard. We both agreed that the MVP was in a good place to begin development, aside from a couple of minor changes. Additional features such as data export to Excel needs to be further explored in order to understand what problems our clients are actually facing and whether or not they can be solved without the need to download an Excel spreadsheet.

- Updated Fiscal Forecast Mockups -
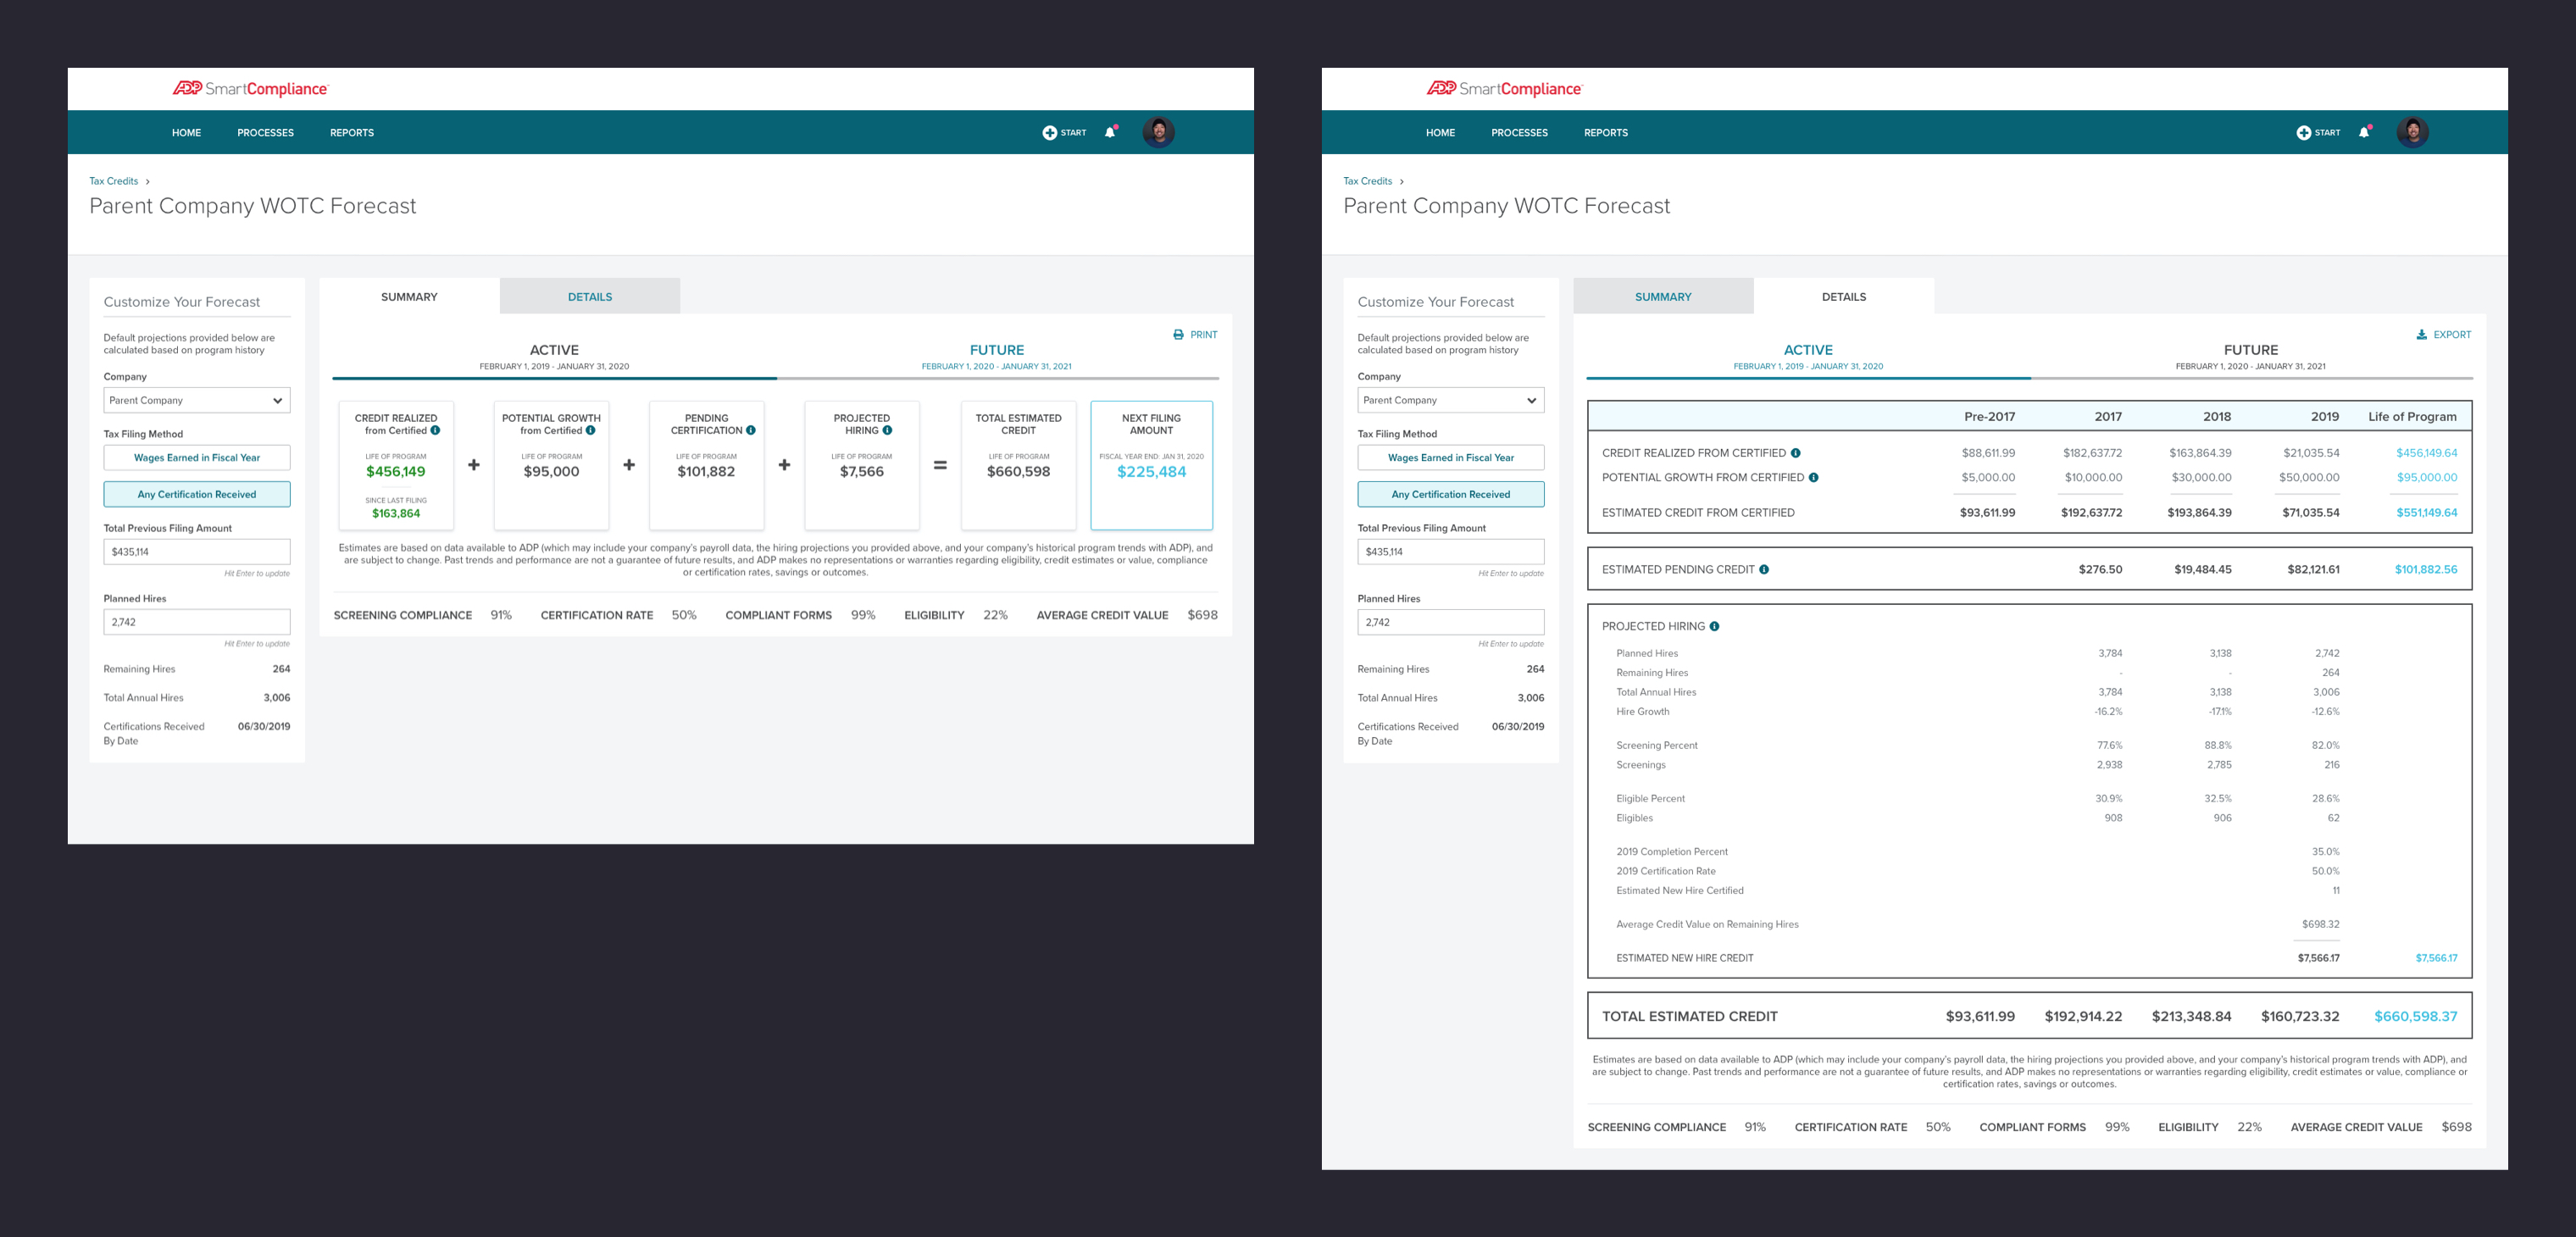
- Updated Growth Forecast Mockups -
Notable changes:
- Updated tab UI for Summary and Details views to be more noticeable and to differentiate from the year tabs
- Changed the labeling for each year tab to Active & Future and removed the previous year tab
- Moved the info icons within the tiles next to the tile headers for better visibility. Also added the icons next to applicable headers within the Details view
- Removed the blue background behind the total estimated credit values on the Details view and instead, highlighted the column values that pertain to the tax filing method selected. For annual filers, either current or future year values will be highlighted depending on year tab selection. For growth filers, Life of Program values will be highlighted